Advancing Equitable Food Environments
- Copyright
- 2017
- Published Date
- 08/22/2017
- Published By
- Community Commons
Better food environments can help all Americans, especially those with low incomes, to reduce the burden of diet-related diseases and achieve better health. The Environments Supporting Healthy Eating (ESHE) Index Hub partners envision a food landscape that is supportive of healthy eating— encouraging people to consume a high-quality diet by raising community awareness of:
- Sufficient access to food
- Mix of stores and restaurants favorable for purchasing healthful foods
- Active participation among organizations with policies that support healthy food access
- Policies and practices that support nutrition education and promotion of healthy foods and limit advertising of less healthy foods
ESHE is a free, standardized scoring tool for describing food environments in terms of their support for healthy eating. ESHE ranks multiple variables including— community nutrition environment, organizational environments, food prices and broader information environment. The result is a numerical score. The score combines county and state indicators that are publicly available and updated to monitor change over time.
Since the launch of the ESHE Index Hub in 2015, communities across the country have utilized the tool to raise awareness, mobilize community action, and support evidence-based decision making in policy development. In doing so, these communities continue their commitment toward eliminating inequities in food environments. Support from the Robert Wood Johnson Foundation has created an opportunity to refine the Hub and update the data layers informing the Index.
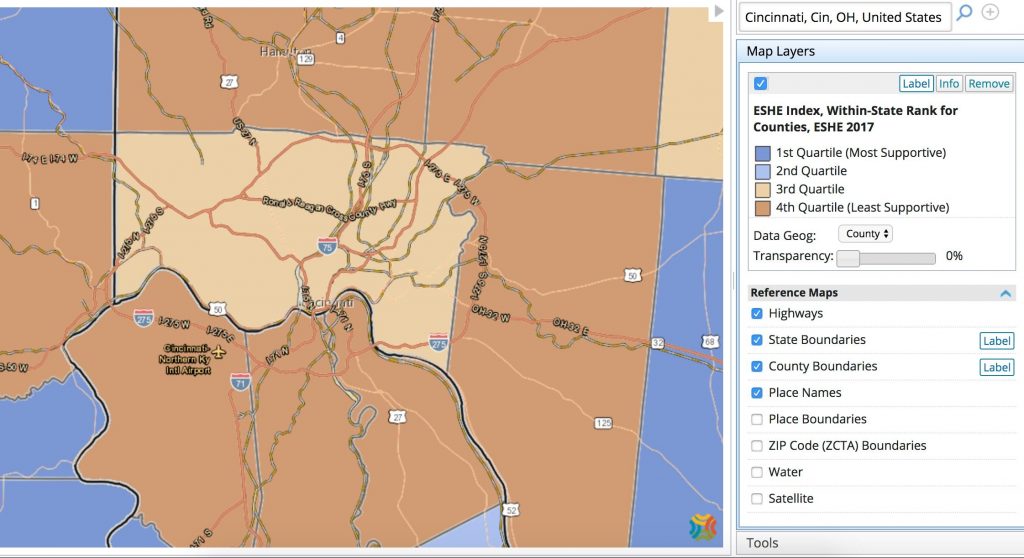
The ESHE Index, hosted on Community Commons, combines several factors that either directly reflect food access and availability in the built environment, or reflect policies that affect the food environment such as:
- Types and locations of food retail outlets and restaurants;
- Nutrition policies and standards in organizational settings where food is provided including public schools and child care centers;
- Nutrition education and access to nutrition information as well as commercial advertising; and
- Food and beverage prices.
Recently the, African American Collaborative Obesity Research Network (AACORN) in partnership with the University of Missouri Center for Applied Research and Engagement Systems (CARES) continue to provide leadership for vital updates to the tool.
What Changed with the Recent Update?
County-level Indicators – Four of the six county-level ESHE Index indicators were updated to reflect more current food environment conditions.
| Indicator | Original Data | New Data |
| Low income population with healthy food access | 2010 | 2015 |
| Low-income access to SNAP-Authorized stores | 2012 | 2016 |
| Access to farmer’s markets | 2015 | 2016 |
| Low-income population access to farmer’s markets | 2015 | 2016 |
State-level Indicators – Among the additional state-level index indicators, two of the four indicators were updated, while another received a substantial source change. Changes to data sources are often necessary to ensure that the most relevant and up to date information are being used. In the case of the Child Care Nutrition Policy Score, the update was made to utilize a dataset that measured the strength of nutrition policies, not just the presence or absence of policies. Moreover, this change secured a new data source that is regularly updated.
| Indicator | Original Data | New Data |
| Additional Sales Tax on Chips and Pretzels | 2011
Bridging the Gap, State Snack and Soda Sales Tax Data |
2014
Bridging the Gap, State Snack and Soda Sales Tax Data |
| Additional Sales Tax on Soda | 2011
Bridging the Gap, State Snack and Soda Sales Tax Data |
2014
Bridging the Gap, State Snack and Soda Sales Tax Data |
| Child Care Nutrition Policy Score | Office of Child Care, National Center on Child Care Quality Improvement, 2011 | University of Colorado Denver, National Resource Center for Health and Safety in Child Care and Early Education, 2015 Supplement |
More Robust Report Indicators – The ESHE Index indicators have been shown to be robust and valuable for assessing food environments. The addition of other, related indicators provide further depth to elucidating the food environment. The related indicators in this new version include: Fast Food Restaurants, Adult Fruit and Vegetable Consumption, Fruit and Vegetable Expenditures, SNAP Authorized Food Stores, Food Insecurity, and Free and Reduced Price Lunch.
CARES GIS Specialist, Angela Johnson explains, “We realize data are constantly changing. The data layers within the ESHE index were updated wherever possible in order to better reflect the current conditions in these communities.”

Resources and Community Tools- The ESHE Hub now hosts new support pages. A new Resources tab provides archived webinars, how-to guides, and data methodology. The new Community Tools tab provides a downloadable Community Measures Toolkit. The Toolkit offers guidance for combining community engagement with data-driven insights to support advocacy, implementation, and monitoring. In addition, you can explore three case studies and learn from diverse communities who have made an impact on local community food access.
The development of the ESHE Hub and Index was made possible thorugh support from the Robert Wood Johnson Foundation COGIS Project.
View StoryRelated Topics
